2023
2023
2023
2023
2023
2023

Ready To Win

I worked with The New York Times to create a series of illustrations for SAP Sports, bringing together athletic performance, data and movement. The artworks explored how real-time insights are changing the way we train, compete and understand sport in a more visual and immediate way.

Credits: Art Direction Kris Taifalos / Designer Hannah Ahn

Illustration

Illustration

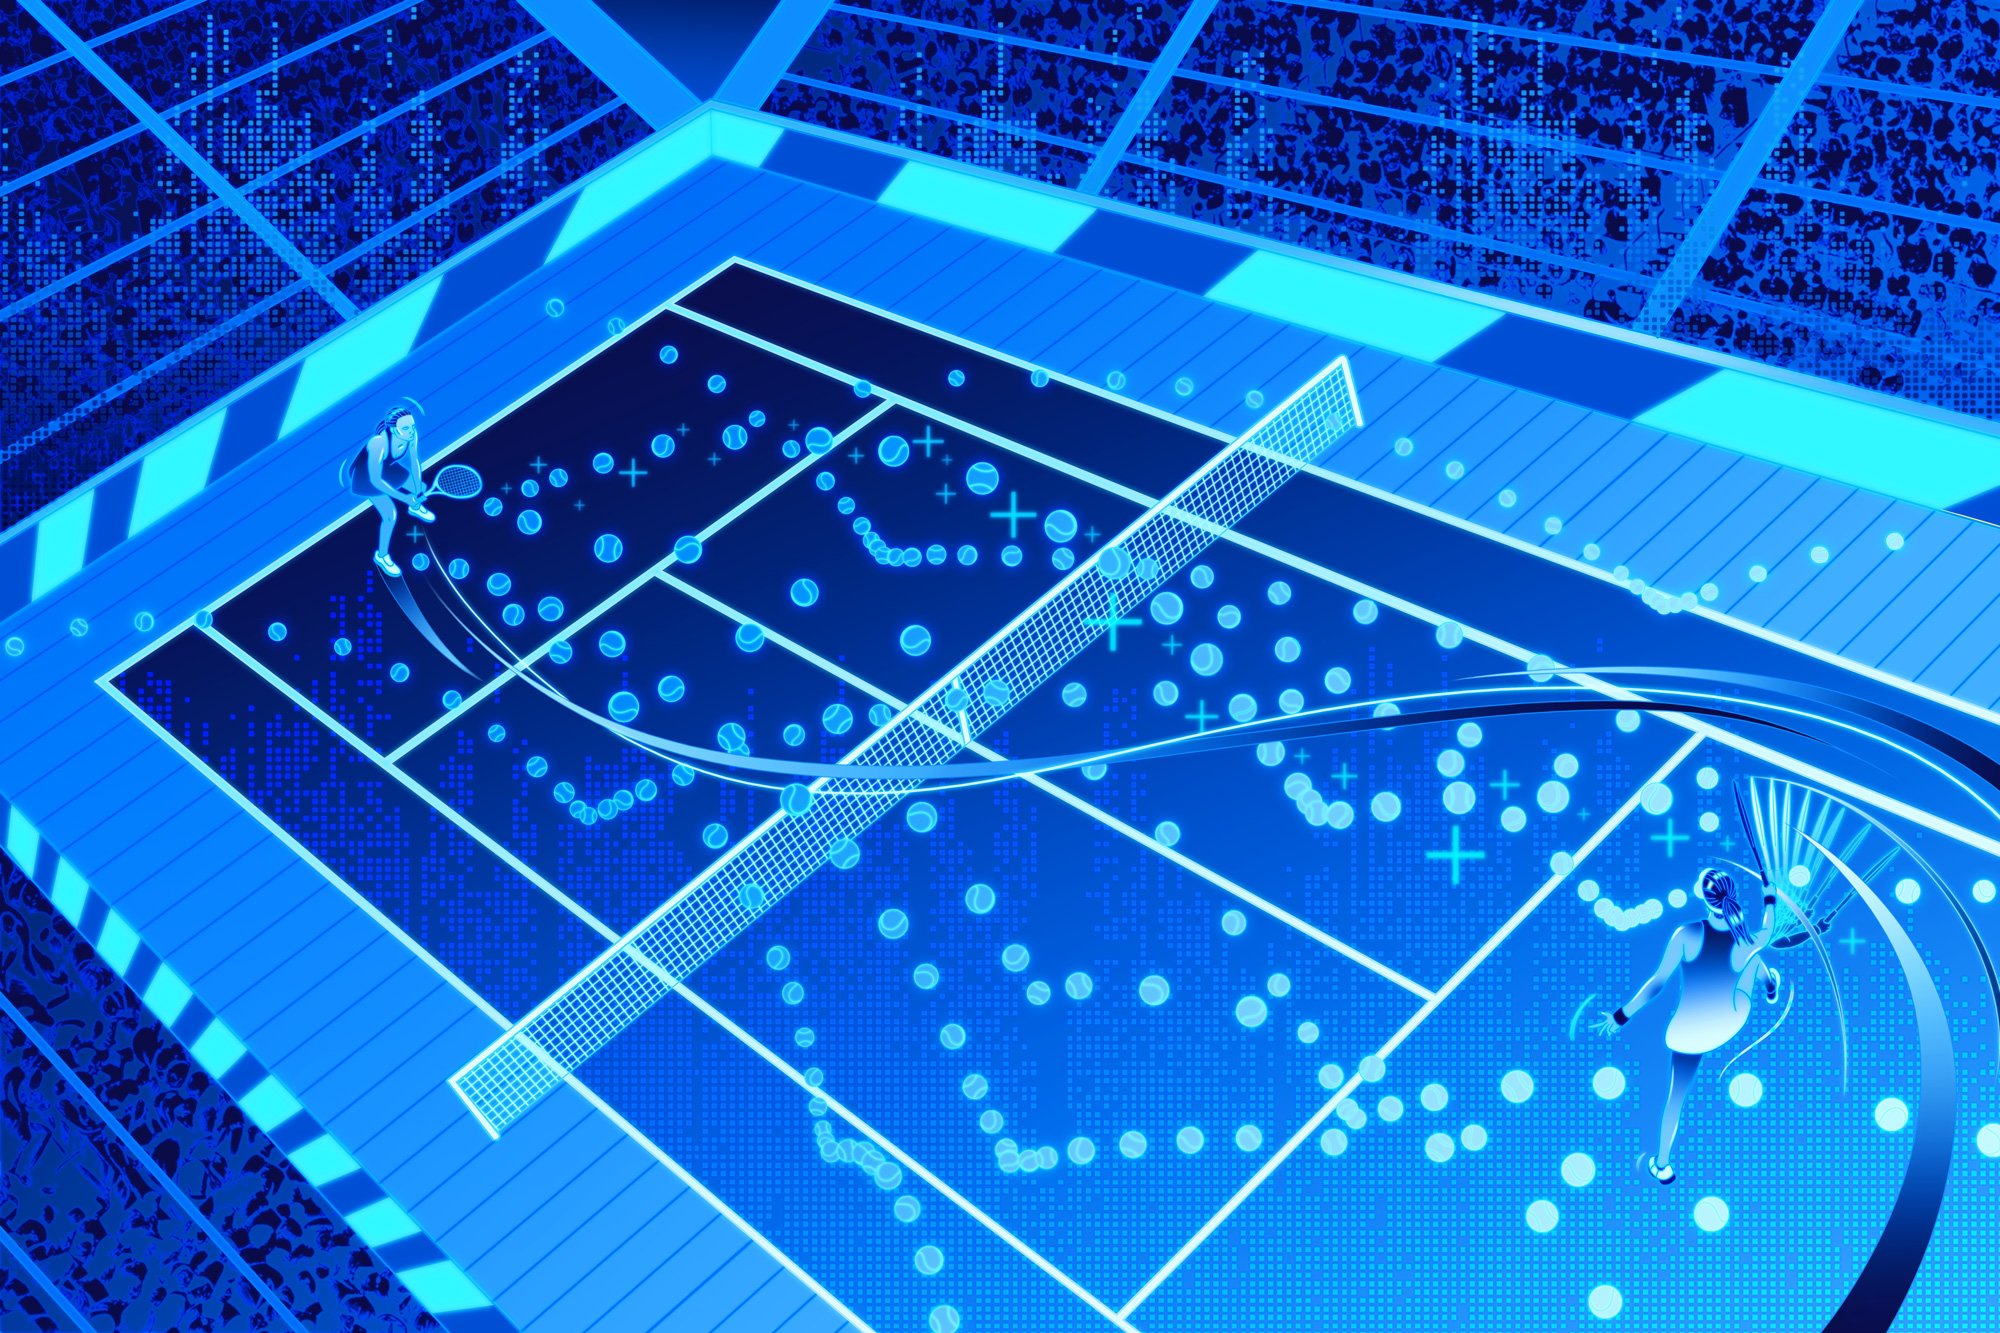
SAP Sports tennis illustration showing a female player returning a shot on court, with colourful data trails and tennis balls visualising real-time performance insights.
SAP Sports tennis artwork showing a blue-toned athlete swinging a racket, with glowing data paths, ball tracking and digital performance graphics.
SAP Sports tennis illustration showing a female player returning a shot on court, with colourful data trails and tennis balls visualising real-time performance insights.
SAP Sports tennis artwork showing a blue-toned athlete swinging a racket, with glowing data paths, ball tracking and digital performance graphics.

CONTEXT

The series explored how real-time insights are changing the way athletes train, compete and understand performance, making data feel more human and connected to sport.

APPROACH

I developed a series of sports illustrations that turned performance data into movement, rhythm and energy. Through layered motion, repeated forms and dynamic compositions, the artworks made real-time insights feel visual, immediate and connected to the athlete.

CONTEXT

The series explored how real-time insights are changing the way athletes train, compete and understand performance, making data feel more human and connected to sport.

APPROACH

I developed a series of sports illustrations that turned performance data into movement, rhythm and energy. Through layered motion, repeated forms and dynamic compositions, the artworks made real-time insights feel visual, immediate and connected to the athlete.

CONTEXT

The series explored how real-time insights are changing the way athletes train, compete and understand performance, making data feel more human and connected to sport.

APPROACH

I developed a series of sports illustrations that turned performance data into movement, rhythm and energy. Through layered motion, repeated forms and dynamic compositions, the artworks made real-time insights feel visual, immediate and connected to the athlete.

SAP Sports multi-sport illustration showing basketball and tennis athletes moving through colourful data trails, connecting athletic performance with real-time sports analytics.
SAP Sports esports illustration showing headset-wearing competitors in profile, with bright data lines representing live strategy, communication and performance analysis.
SAP Sports esports artwork showing a gamer at a computer surrounded by glowing analytics graphics, visualising real-time data and competitive decision-making.
SAP Sports esports illustration showing headset-wearing competitors in profile, with bright data lines representing live strategy, communication and performance analysis.
SAP Sports esports artwork showing a gamer at a computer surrounded by glowing analytics graphics, visualising real-time data and competitive decision-making.
SAP Sports multi-sport illustration showing basketball and tennis athletes moving through colourful data trails, connecting athletic performance with real-time sports analytics.
SAP Sports basketball illustration showing a player dribbling through a blue digital court, with glowing motion trails and data-inspired performance visuals.
SAP Sports close-up illustration of a hand using a computer mouse, with bold red and yellow data lines showing digital input, speed and real-time performance tracking.
SAP Sports basketball illustration showing a player dribbling through a blue digital court, with glowing motion trails and data-inspired performance visuals.
SAP Sports multi-sport illustration showing basketball and tennis athletes moving through colourful data trails, connecting athletic performance with real-time sports analytics.

Menu